← All activities
Lesson 5 · Exercise
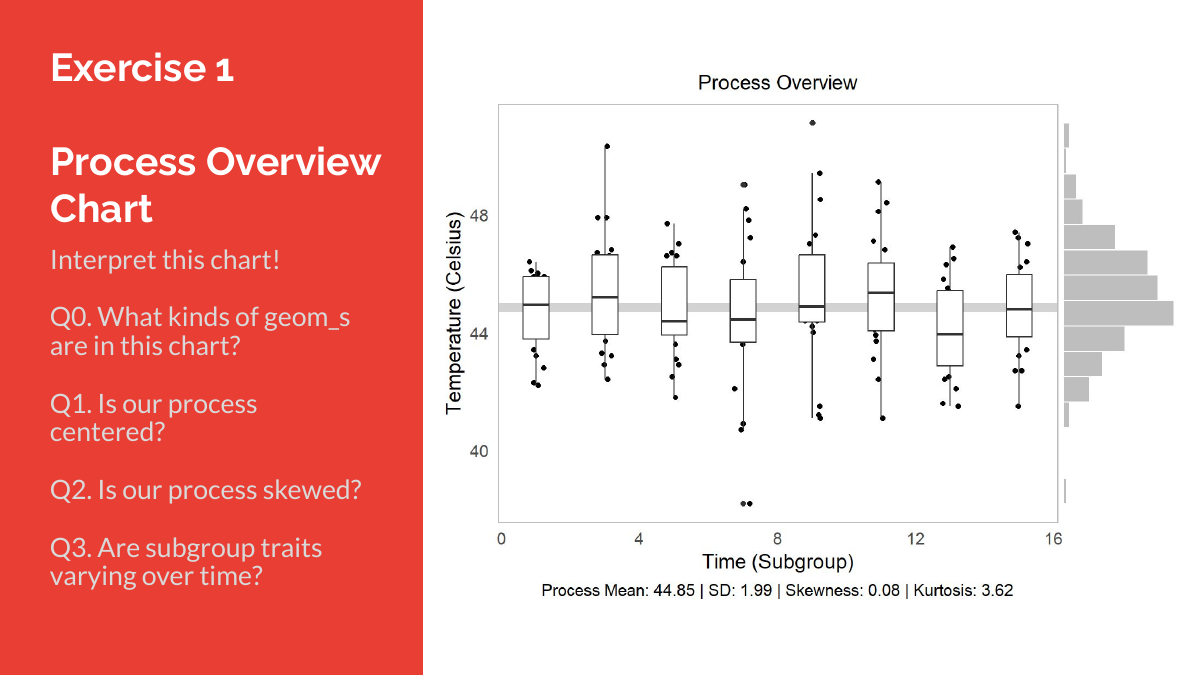
Exercise 1: Interpret this Process Overview Chart
An in-class activity from the course slides — reproduced here so you can find it again after class.
📋 What to do
- Interpret this chart.
- Q0. What kinds of geom_s are in this chart?
- Q1. Is our process centered?
- Q2. Is our process skewed?
- Q3. Are subgroup traits varying over time?
📮 Submit
Discussed live in lesson, then answered as a pop quiz that opens on Canvas during class (1 pt) — graded on accuracy. It appears in this week’s module on Canvas once your instructor opens it.
Note: these instructions are the current version — the activity is written and kept up to date on this page, links to slide decks and helper materials included. Submit on Canvas; the due date and your grade live there.