🙋 Activities
Every in-class activity from the course slides, in one place — expand a card to see exactly what to do and where it gets submitted.
Cards are collapsed by default and ordered the way the slide decks run. Links inside them (CANVAS assignments, shared slide decks, helper materials) are carried over from the original slides and may update before class.
Canvas Activity: Cornell Image & Voice Release Form Week 1
- Open the Cornell Image & Voice Release Form linked from the Canvas assignment (1–2 minutes).
- Fill it out and submit it.
- Screenshot the survey header showing your name and paste it into the Canvas text box.
📮 Submit on Canvas (1 pt) — graded on completion; your deadline is on the Canvas assignment.
Open the full activity page →CanvasAttendance ChecksAny week
- Eight 1-point checks appear on Canvas sporadically through the term, enacted in class on unannounced days.
- Be in class; when a check opens, submit it before it closes.
- Distance students: your section's corresponding check follows the usual DL window.
📮 Submit on CANVAS — no make-ups, since the days are unannounced.
Canvas Activity: Post It Week 1
- Make your first post on Ed Discussion, our course Q&A forum.
- Ask a specific, practical question about a reading, lecture, coding example, or concept — not an opinion question.
- Use a clear subject line and tags so the post is easy to find later.
- Paste a screenshot of your post and a link to it into the Canvas text box.
📮 Submit on Canvas (1 pt) — graded on completion; your deadline is on the Canvas assignment.
Open the full activity page →Canvas Activity: Teams Survey Week 1
- Fill out the Teams Survey — no sign-in needed; it helps your instructor prepare the course to suit the group.
- Copy the reference number the thank-you page gives you.
- Paste the reference number into the Canvas text box.
📮 Submit on Canvas (1 pt) — graded on completion; your deadline is on the Canvas assignment.
Open the full activity page →Canvas Activity: Book Your First Office Hours Week 1
- Go to the Office Hours page (Canvas > Home > Shortcuts).
- Pick an in-person, distance-learning, or TA menu and book one slot early in the term.
- You can come as an individual or a team — just make sure the invite says who is coming.
- Paste a screenshot of the successful booking into the Canvas text box.
📮 Submit on Canvas (1 pt) — graded on completion; your deadline is on the Canvas assignment.
Open the full activity page →Your Turn! Introductions Lesson 1
- Turn to 5 neighbors.
- It's your job to know their first name, program, and why they are here.
📮 Nothing to submit — done live in class.
Open the full activity page →Activity: Setup account with Posit.Cloud Workshop 1
- Make a free account at posit.cloud.
- New Project → New Project from Git Repository, and paste https://github.com/timothyfraser/sysen
- In the Console, run source("workshops/packages.R") once and let it finish.
- Done-check: library(dplyr) then read.csv("workshops/mydiamonds.csv") %>% head()
📮 Submit a screenshot of your Posit.Cloud setup on CANVAS (1 pt) — graded on completion.
Open the full activity page →In-Class Activity: Statistical Coding Workshop 1
- Work through the statistical coding questions from today's workshop.
- Submit your answers on CANVAS — your deadline is on the Canvas assignment.
📮 Submit answers on CANVAS (1 pt) — graded on completion; your deadline is on the Canvas assignment.
Open the full activity page →In-Class Activity: Statistical Coding (reminder) Recitation 1
- Reminder: the In-Class Activity — Statistical Coding — started in workshop is still open.
- Using your new coding skills, answer the questions in the Canvas assignment "Activity: Try It (Statistical Coding) [In-class]".
- When you're finished, copy and paste your code and any comments into the text box submission for this Canvas assignment.
- Graded on completion, not correctness.
📮 Submit answers on CANVAS (1 pt) — graded on completion; your deadline is on the Canvas assignment.
Open the full activity page →
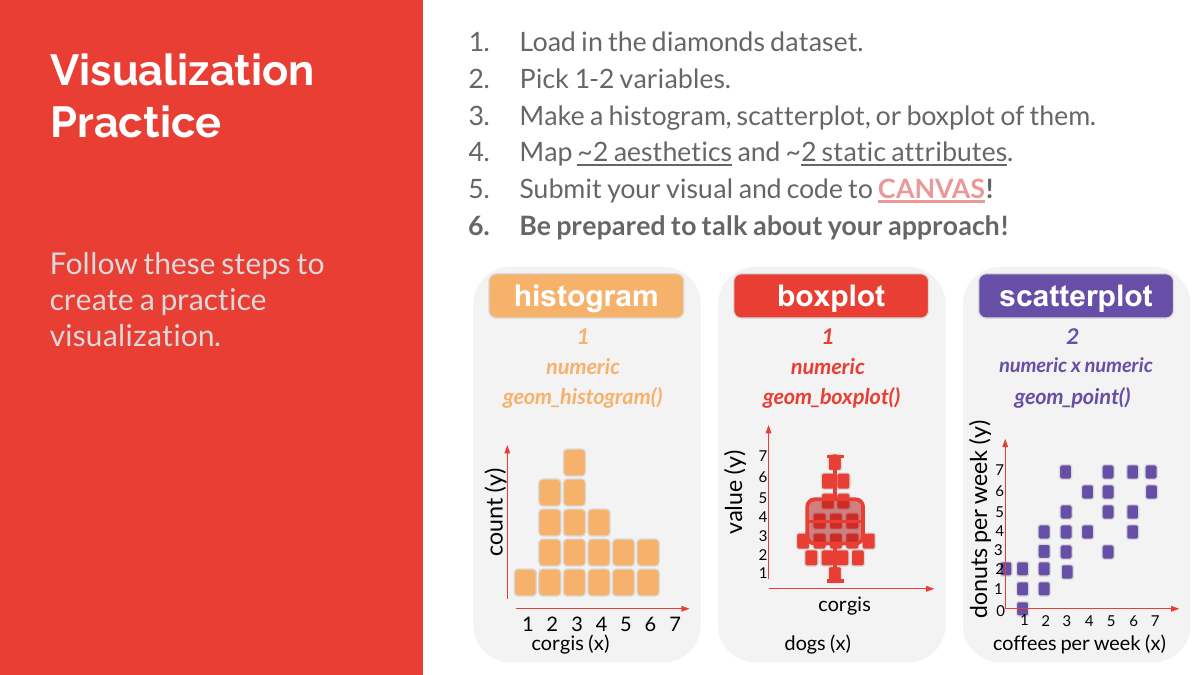 Visualization Practice: Make a practice visualization
Recitation 1
Visualization Practice: Make a practice visualization
Recitation 1
- 1. Load in the diamonds dataset: diamonds = ggplot2::diamonds %>% sample_n(1000)
- 2. Pick 1-2 variables.
- 3. Make a histogram, scatterplot, or boxplot of them.
- 4. Map ~2 aesthetics (inside aes()) and ~2 static attributes (outside aes()).
- 5. Submit your visual and code to CANVAS!
- 6. Be prepared to talk about your approach!
📮 Submit your visual and code on CANVAS (1 pt) — graded on completion.
Open the full activity page →Canvas Activity: Finalize Team Members Week 2
- Identify your homework group. Your homework group and your project group are separate Canvas groups — both were seeded from your Starter Team, so they line up right now, but they do not have to stay the same.
- Write down the full names and netIDs of every member, plus your team name.
- Update your team on Canvas > People > Groups > Homework Groups.
- Each teammate submits this individually, to show you are actively choosing this group.
📮 Submit on Canvas (1 pt) — graded on completion; your deadline is on the Canvas assignment.
Open the full activity page →Failure Mode & Effects Analysis: Exercise Lesson 2
- Pick one technology from the list (mobile phone, coffee maker, infant bouncy chair, newborn onesie, toaster, scooter).
- Outline 3–5 potential failure modes.
- Assign rough scores 1–10 and calculate RPN.
- Copy the FMEA sheet template (copy it, don't edit the original) and record your findings there — the link is on the full activity page.
- Work the FMEA with your group, then bring your sheet to the class discussion.
📮 Bring your FMEA sheet to the class discussion, then submit it on CANVAS (1 pt) — graded on completion.
Open the full activity page →Canvas Activity: Code It (Distributions) Week 3
- Complete Learning Check 4 from the Distributions and Descriptive Statistics chapter.
- Work out which distribution best matches the observed data, in R or Python.
- Comment your code line by line in your own words — no AI-generated commenting.
- Paste your commented code plus a 1–2 sentence summary into the Canvas text box.
📮 Submit on Canvas (1 pt) — graded on completion; your deadline is on the Canvas assignment.
Open the full activity page →
 Your Turn! Analyze your vector (Louisiana Parishes)
Recitation 2
Your Turn! Analyze your vector (Louisiana Parishes)
Recitation 2
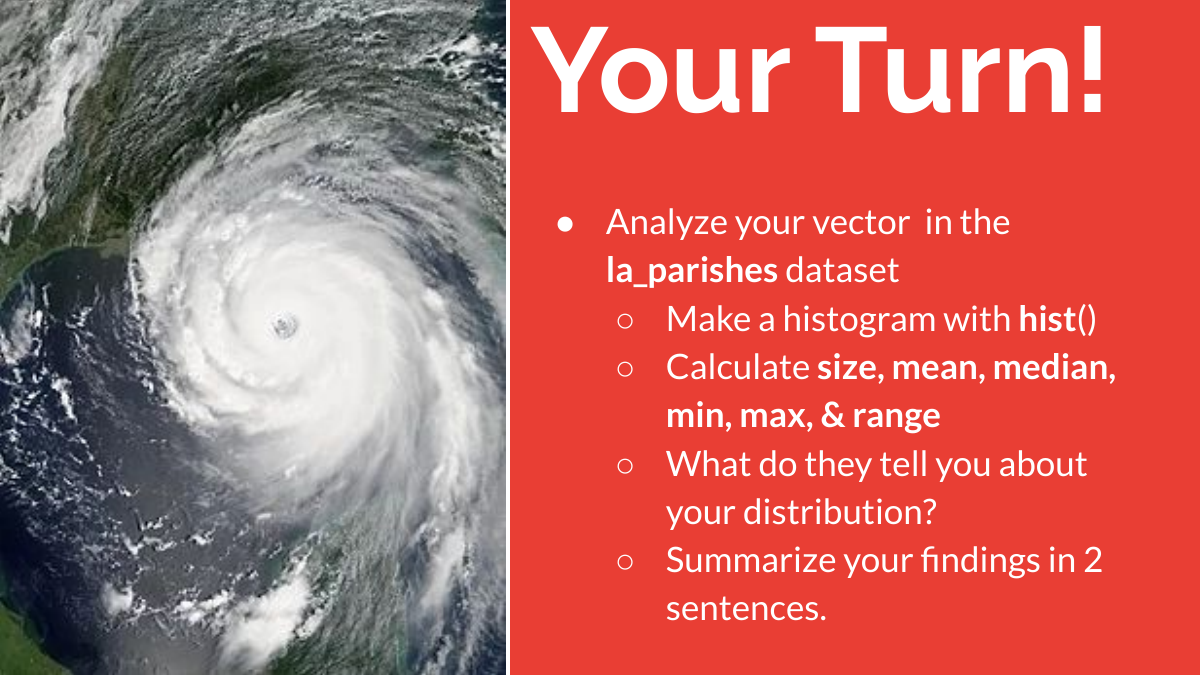
- Analyze your vector in the la_parishes dataset.
- Make a histogram with hist(); calculate size, mean, median, min, max, & range. What do they tell you about your distribution? Summarize your findings in 2 sentences.
- Calculate standard deviation, variance, coefficient of variation, & standard error. Summarize your thoughts in 2 sentences.
- Calculate skewness and kurtosis. Summarize your thoughts in 1 sentence.
- Calculate parameters for each distribution (except weibull), simulate 100 observations each, visually compare your vector with the simulated data — which matches your vector best?
📮 Share your findings in recitation.
Open the full activity page →Pop Quiz: Cheese Product Comparison Recitation 2
- Three firms produce cheese in Upstate New York; each sampled units and recorded time to mold, in hours.
- Take the three vectors a, b, and c from the slide into R (or Python).
- Evaluate the three distributions with descriptive statistics (mean, median, standard deviation, coefficient of variation).
- Decide which firm you would buy your cheese from: A, B, or C.
📮 Take the pop quiz on Canvas (1 pt, graded on accuracy).
Open the full activity page →Canvas Activity: Code It (Probability) Week 4
- Complete Learning Check 1 from the Probability Functions chapter.
- Calculate the probability that customers stop at more than 5 stalls using Normal, Gamma, and Exponential functions.
- Comment your code line by line in your own words — no AI-generated commenting.
- Paste your commented code plus a 1–2 sentence summary into the Canvas text box.
📮 Submit on Canvas (1 pt) — graded on completion; your deadline is on the Canvas assignment.
Open the full activity page →Canvas Activity: Peer Review (Homework 1) Week 4
- You have been assigned 2 group submissions from Homework 1 to peer review.
- Find them in the Canvas To-Dos list or Recent Activity window.
- Give each one 1 positive comment and 1 gentle suggestion. Be nice!
- Keep a copy of your comments and paste them into the Canvas text box.
📮 Submit on Canvas (1 pt) — graded on completion; your deadline is on the Canvas assignment.
Open the full activity page →Pop Quiz: Normal & Exponential Stalls Lesson 3
- n = 500 farmers-market customers: mean of 5.5 stalls, median of 5 stalls, standard deviation of 2.5 stalls.
- Calculate the probability a customer stops at more than 5 stalls under the Normal distribution.
- Calculate the same probability under the Exponential distribution.
- Report both, and be ready to say which assumption you would trust here.
📮 Take the pop quiz on Canvas (1 pt, graded on accuracy).
Open the full activity page →
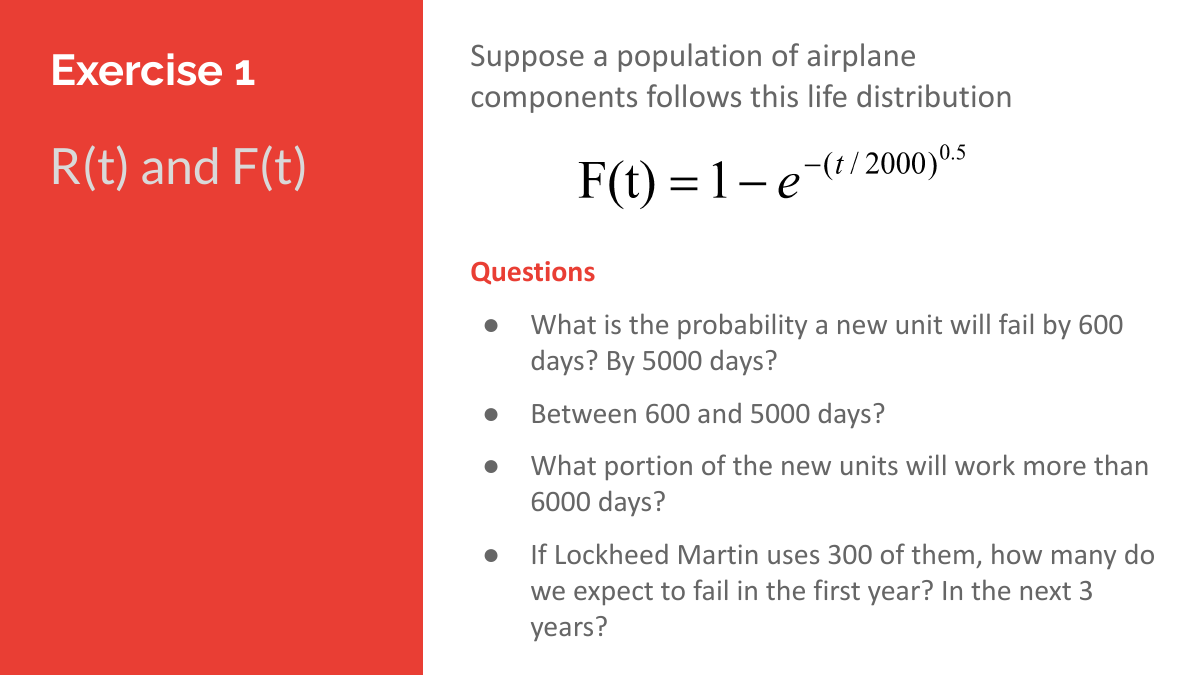 Exercises 1 & 2: Life Distributions
Lesson 4
Exercises 1 & 2: Life Distributions
Lesson 4
- Exercise 1: given a life distribution for a set of components, find the probability a new unit will fail by 600 hours.
- Exercise 2: a computer with 3500 identical and independent components — work the reliability question that follows.
📮 Worked live; solutions follow in the deck.
Open the full activity page →
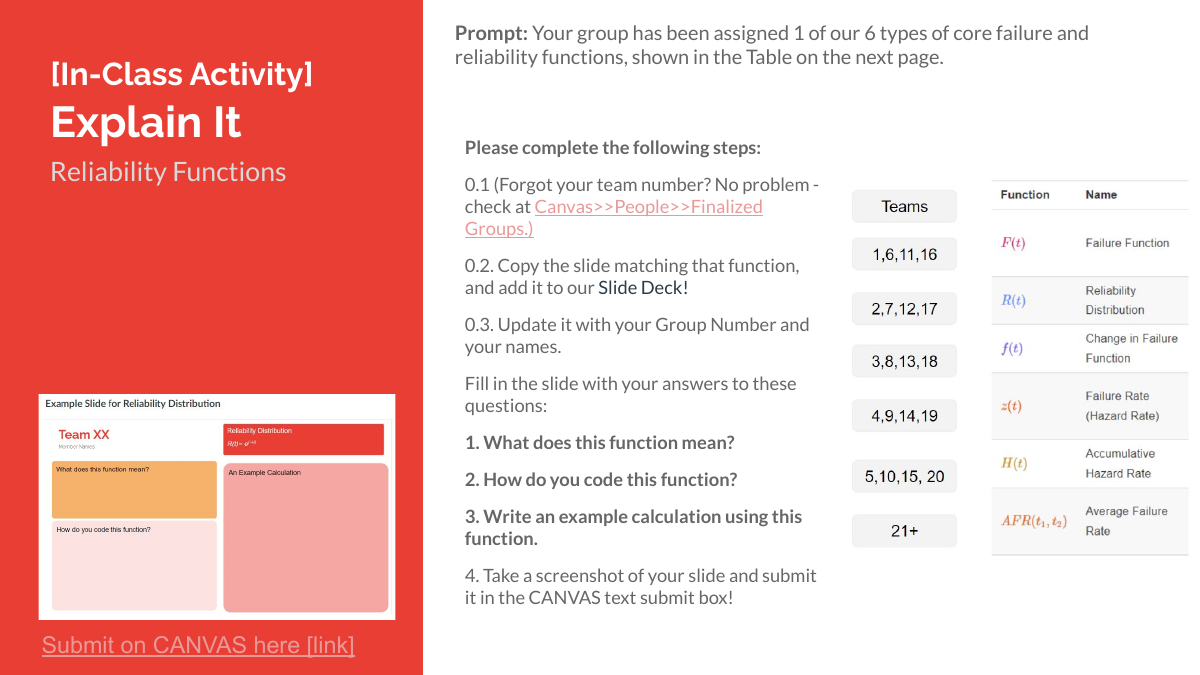 [In-Class Activity] Explain It: Reliability Functions
Workshop 4
[In-Class Activity] Explain It: Reliability Functions
Workshop 4
- Your group has been assigned 1 of our 6 types of core failure and reliability functions, shown in the table in the activity deck.
- 0.1 Forgot your team number? Check at Canvas >> People >> Finalized Groups.
- 0.2 Copy the slide matching that function, and add it to our slide deck.
- 0.3 Update it with your group number and your names.
- 1. Fill in the slide with your answers to these questions: What does this function mean?
- 4. Take a screenshot of your slide and submit it in the CANVAS text submit box.
📮 Submit on CANVAS here [link]. Follow the steps on the CANVAS assignment.
Open the full activity page →[In-Class Activity] Practice It: Block Diagrams Recitation 4
- Pick one of the following systems and estimate system reliability at a specific time (e.g. t = 1000 hours), assuming an exponential lifespan distribution.
- Copy the corresponding slide below into the slide deck and show your reliability function and calculation.
📮 Submit on CANVAS here [link].
Open the full activity page →
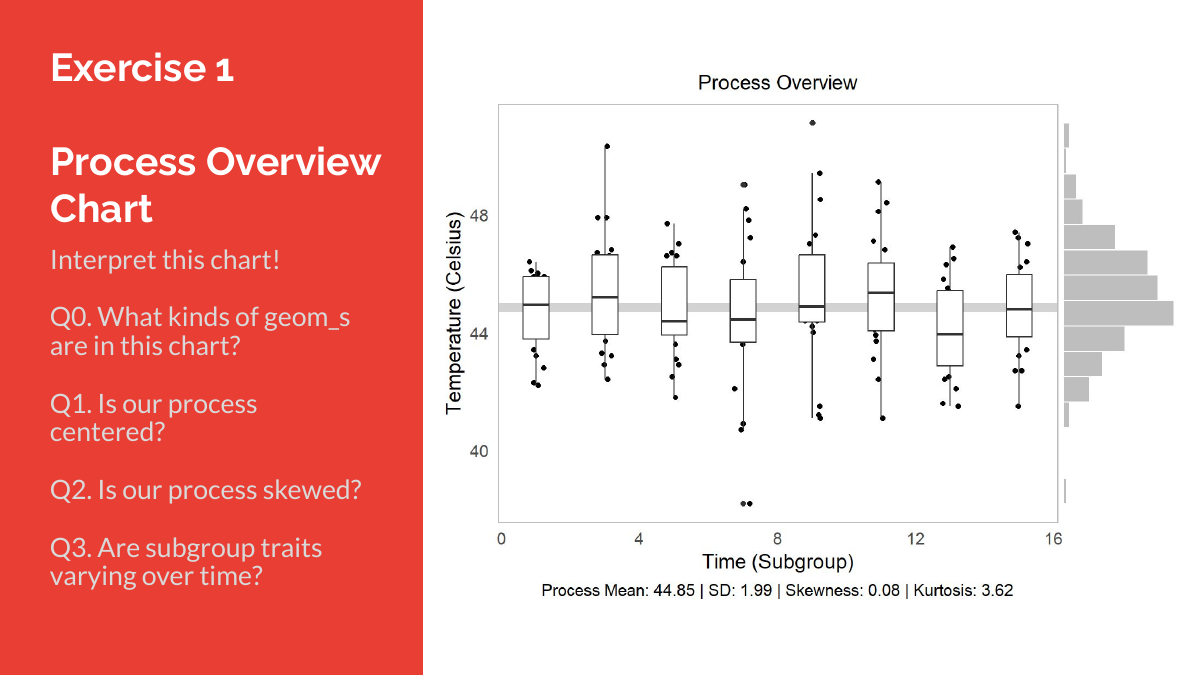 Exercise 1: Interpret this Process Overview Chart
Lesson 5
Exercise 1: Interpret this Process Overview Chart
Lesson 5
- Interpret this chart.
- Q0. What kinds of geom_s are in this chart?
- Q1. Is our process centered?
- Q2. Is our process skewed?
- Q3. Are subgroup traits varying over time?
📮 Discussed live in lesson.
Open the full activity page →[In-Class Activity] Explain It: Statistical Process Control Workshop 5
- Your group has been assigned 1 of the following reading questions in our slides.
- 0.1 Forgot your team number? Check at Canvas >> People >> Finalized Groups.
- 0.2 Copy the slide matching that question, and add it to this slide deck.
- 0.3 Update it with your group number and your names.
- 1. Fill in the slide with your answers to these questions.
- 2. Take a screenshot of your slide and submit it in the CANVAS text submit box.
📮 Reminder: Submit on CANVAS!
Open the full activity page →Coding Exercises: Process Control Functions Recitation 5
- Exercise 1: Copy and read through functions_process_control.R from Github. What do dn and bn do? What does ggprocess do? What does ggs do? What does ggr do?
- Exercise 2: Pick a quality metric from our onsen dataset, and generate averages, standard deviation, and range plots using our helper functions. Describe your process.
📮 Share your plots and description in recitation.
Open the full activity page →
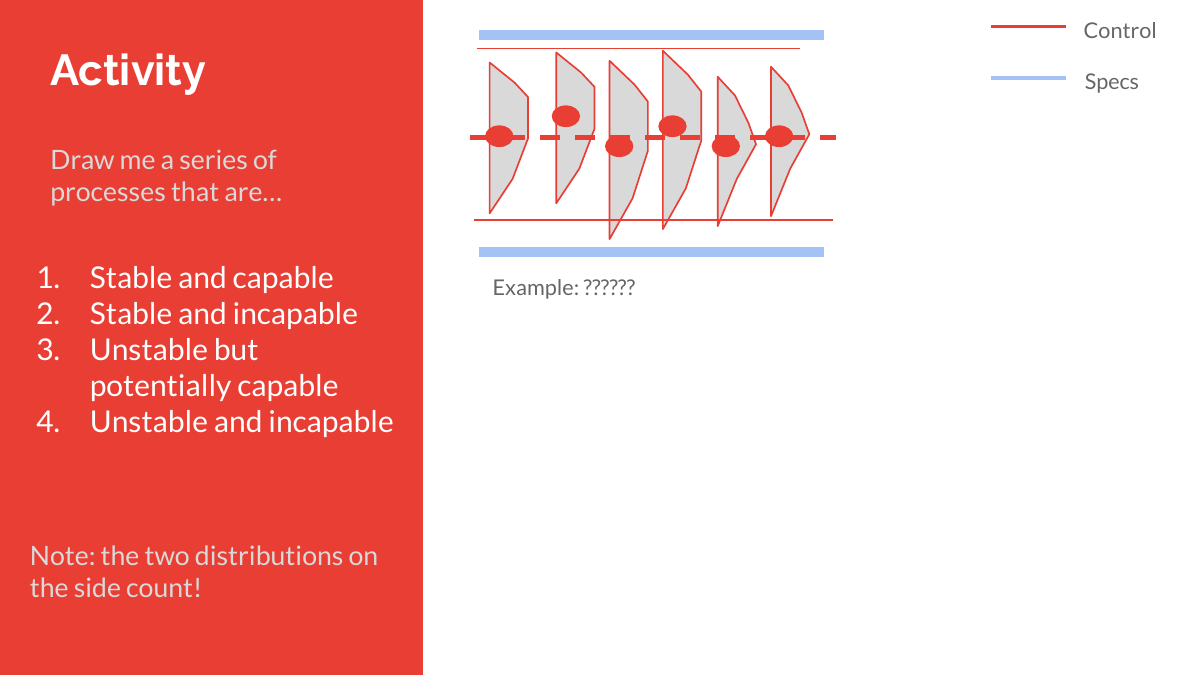 Activity: Draw me a series of processes
Lesson 6
Activity: Draw me a series of processes
Lesson 6
- Draw me a series of processes that are:
- 1. Stable and capable
- 2. Stable and incapable
- 3. Unstable but potentially capable
- 4. Unstable and incapable
- Note: the two distributions on the side count!
📮 Sketch it and compare against the example slide that follows.
Open the full activity page →Activity: Code It — SPC (Individual) Workshop 6
- Code the statistical process control task from the workshop, individually.
📮 Remember: Submit on Canvas! (Individual)
Open the full activity page →Activity: Draw It (Processes) Merged into Draw Me a Process
Same task as Draw Me a Process — submit it there. If you already submitted this one on Canvas, your credit is on Draw Me a Process.
- Estimated Time: 5 minutes · Your Task
- Using a Pen/Pencil/Stylus, please sketch out 4 scatterplots of process quality metric outcomes for a process of interest to you. You should end up with 4 process scatterplots, including 1 plot each that is: Stable and Capable; Stable but not Capable; Unstable but Capable; Unstable and Not Capable.
- Each drawing should include: Labeled Y and X axes; Raw data, not means (though it can be made up); Control Limit(s); Specification Limit(s); Clear title explaining what the process is; Clear label explaining which type this is - "eg. Stable and Capable".
- Submission Requirement: Take a screenshot/png of your drawings and submit it in the CANVAS text submit box!
- One team member can submit this in the CANVAS textbox on behalf of the team.
Activity: Code It! (Process Indices) Workshop 6
- Learning Check.
- A manufacturer of granola bars is aiming for a weight of 2 ounces (oz), plus or minus 0.05 oz. Suppose the standard deviation of our granola bar machine is 0.02 oz, and the mean weight is 2.01 oz.
- What's the process capability index? (I.e. How many times greater is the expected variation than the observed variation?)
📮 Reminder: Submit your code on CANVAS! (Individual)
Open the full activity page →Activity: Practice It (Bootstrapping!) Workshop 6
- Estimated Time: 15 minutes · Your Task
- Bootstrapping is the computational process of iteratively computing the same statistic from samples that differ just slightly due to random sampling with replacement.
- Bootstrapping returns ~1000 statistics, each just slightly different due to chance, that approximate the true shape of the sampling distribution for that statistic.
- In this activity, you will practice bootstrapping using the workshops/onsen.csv dataset.
- Please complete the following steps: Load in your dataset. Select a variable of interest. Select a statistic of interest and compute it one time (eg. xbbar, sbar, rbar, sigma_s, etc.).
- Bootstrap your dataset to get 1000 slightly different copies of the dataset.
- Using grouping by a unique id for each bootstrapped copy of the dataset, calculate the statistic again.
- Estimate the mean and standard error of the bootstrapped statistics. (The standard deviation of a sampling distribution is the standard error.)
- Explain the result in 1-2 sentences.
- Submission Requirement: Copy and paste your commented code into the CANVAS submit textbox below. Copy your mean and standard error for the statistic, and your description.
📮 Remember to submit on CANVAS! (Individual)
Open the full activity page →[In-Class Activity] Explain It: Process Control Indices Workshop 6
- Your group has been assigned 1 of the 6 Process Control Indices questions on the activity page.
- 0.1 Open the Team Boards and choose the topic “Explain It Process Indices”.
- 0.2 Pick the problem for your team's question, and put your team name and members in the header first.
- 1. Answer in the Notes pane; put any code in the Code pane.
- 2. Press Save, then Copy for Canvas, and paste it into the Canvas text box.
📮 Reminder: Submit on CANVAS!
Open the full activity page →Activity: Practice It — Bootstrapping (Recitation) Recitation 6
- Practice bootstrapping again with the recitation's worked example.
📮 Remember to submit on CANVAS! (Individual)
Open the full activity page →Canvas Activity: Code It — Create a GitHub Repository Week 7
- List your GitHub ID. (No account yet? Go back to the Posit.Cloud setup activity first.)
- Create a GitHub repository with a simple, lowercase, no-spaces name — one per team is fine.
- Add one group member as a collaborator under Settings > Collaborators.
- Paste the repository URL and screenshots of each step into the Canvas text box.
📮 Submit on Canvas (1 pt) — graded on completion; your deadline is on the Canvas assignment.
Open the full activity page →Canvas Activity: Code It — Commit, Pull, and Push on GitHub Week 7
- Prerequisites: a GitHub account, a repository you own or were added to, and its full URL.
- In GitHub > Developer Settings, create a Personal Access Token — classic (with the repo and public_repo scopes) or fine-grained for one repository.
- Give the token an expiration date after the end of this term.
- Use the token to commit, pull, and push, and paste screenshots of each step into the Canvas text box.
📮 Submit on Canvas (1 pt) — graded on completion; your deadline is on the Canvas assignment.
Open the full activity page →Canvas Activity: Install Git, Git Bash and curl Week 8
- Download and run the Git installer for your operating system (Git Bash comes with it on Windows).
- Check that curl works (it is built into recent Windows and macOS).
- Open Git Bash (Terminal on macOS/Linux) and run git --version and curl --version.
- Screenshot the output of both commands and paste it into the Canvas text box.
📮 Submit on Canvas (1 pt) — graded on completion; your deadline is on the Canvas assignment.
Open the full activity page →Canvas Activity: Your first curl query Week 8
- Open Git Bash (Terminal on macOS/Linux).
- Make a GET request to the practice API, then add a query parameter and a header.
- Send data with a POST request.
- Screenshot the JSON response from at least one command and paste it into the Canvas text box.
📮 Submit on Canvas (1 pt) — graded on completion; your deadline is on the Canvas assignment.
Open the full activity page →Canvas Activity: Set Up Your GitHub Account and Full Name Week 8
- Sign up at github.com (not a GitHub Enterprise site) with a professional username.
- Edit your profile: set your full name and a recognizable profile picture.
- In Git Bash, set git config --global user.name and user.email, then check with git config --get user.name.
- Screenshot your GitHub profile and the git config output, and paste both into the Canvas text box.
📮 Submit on Canvas (1 pt) — graded on completion; your deadline is on the Canvas assignment.
Open the full activity page →Canvas Activity: Make a GitHub Repo Week 8
- List your GitHub ID.
- Create a GitHub repository with a simple, lowercase, no-spaces name.
- Add one team member as a collaborator under Settings > Collaborators.
- Paste the repository URL and a screenshot of each step into the Canvas text box.
📮 Submit on Canvas (1 pt) — graded on completion; your deadline is on the Canvas assignment.
Open the full activity page →Canvas Activity: Open Your Repo on Your Computer Week 8
- Create a personal access token in GitHub > Developer settings, and store it somewhere secure.
- Clone your repository with Git Bash and open the folder in your editor.
- Change README.md, then git add, git commit, and git push.
- Copy the URL of your new commit page and paste it into the Canvas text box.
📮 Submit on Canvas (1 pt) — graded on completion; your deadline is on the Canvas assignment.
Open the full activity page →Canvas Activity: Install Python, R and an Editor Week 8
- Install an editor (optional): Positron, RStudio, VS Code, or any you like.
- Install Python and R, and tell Git Bash where to find them if needed.
- In Git Bash, run python --version and R --version.
- Screenshot both outputs and paste them into the Canvas text box.
📮 Submit on Canvas (1 pt) — graded on completion; your deadline is on the Canvas assignment.
Open the full activity page →Canvas Activity: Install Your Coding Agent Week 8
- Pick a coding agent (a free path exists if you have no paid plan).
- Install it, then cd into your cloned repository in Git Bash.
- Start the agent and ask: What files are in this repo, and what is it for? Two sentences.
- Screenshot the agent's answer and paste it into the Canvas text box. Never paste an API key anywhere.
📮 Submit on Canvas (1 pt) — graded on completion; your deadline is on the Canvas assignment.
Open the full activity page →Canvas Activity: Midterm Eval for TAs and CAs Week 7
- A short anonymous survey about the TAs and course assistants. The survey link is on the activity page.
📮 Submit on Canvas (1 pt) — type Done once you have finished; your deadline is on the Canvas assignment.
Open the full activity page →Canvas Activity: Midterm Eval for Course Instructor Week 7
- The college's mid-semester feedback survey for this course. Your personalized link comes by email; the activity page says where to find it.
📮 Submit on Canvas (1 pt) — type Done once you have finished; your deadline is on the Canvas assignment.
Open the full activity page →Canvas Activity: Practice It (Permutation Tests) Week 8
- Load the workshops/lattes.csv dataset and pick an outcome (Y), a predictor (X), and a statistic — a difference of means or an F-statistic.
- Compute the statistic once, then permute the dataset ~1000 times and recompute it for each permuted version.
- Report the range of your permuted statistics and the share more extreme than your observed one — that is a one-tailed p-value.
- Paste your commented code, your numbers, and a 1–2 sentence explanation into the Canvas text box.
📮 Submit on Canvas (1 pt) — graded on completion; your deadline is on the Canvas assignment.
Open the full activity page →[Retired] Activity: You Choose (Final-Week Topics) Retired
This activity has been retired. There is no topic poll to answer and nothing to submit.
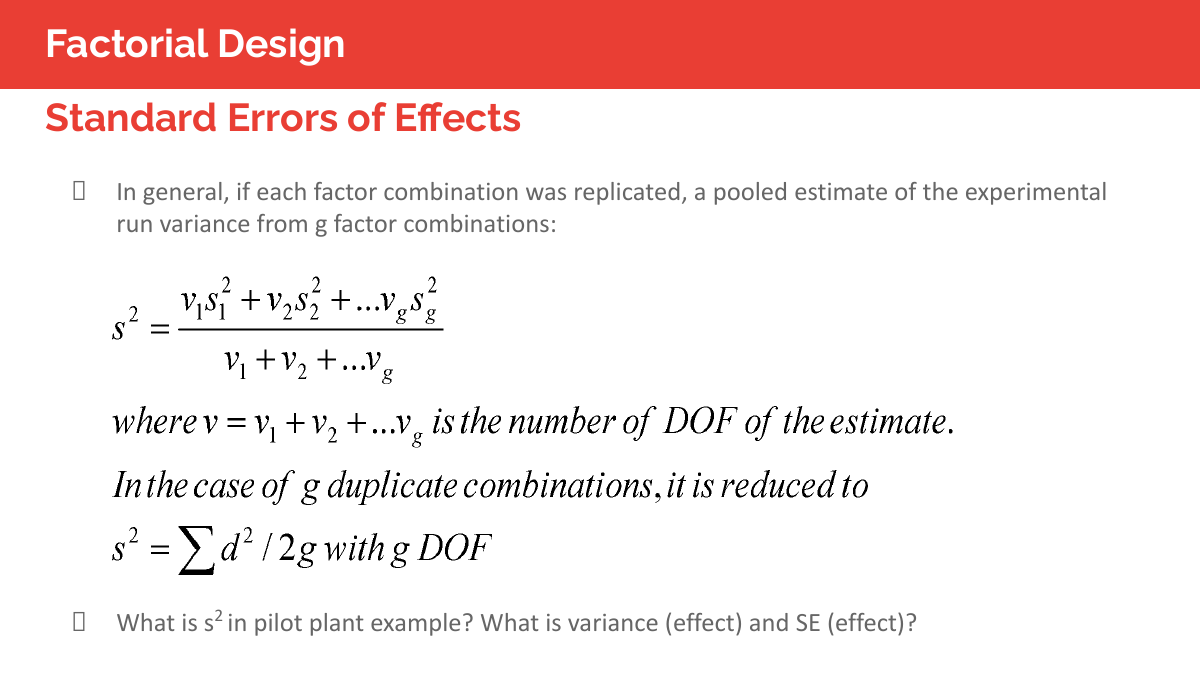 Standard Errors of Effects: s² in the Pilot Plant Example
Lesson 13
Standard Errors of Effects: s² in the Pilot Plant Example
Lesson 13
- In general, if each factor combination was replicated, a pooled estimate of the experimental run variance from g factor combinations is s² = (v1·s1² + v2·s2² + … + vg·sg²) / (v1 + v2 + … + vg), where v = v1 + v2 + … + vg is the number of DOF of the estimate.
- In the case of g duplicate combinations it is reduced to s² = Σd² / 2g with g DOF.
- What is s² in pilot plant example? What is variance (effect) and SE (effect)?
📮 Nothing to submit — worked through live in lecture.
Open the full activity page →Group Activity: Explain It! Factorial Experiments Workshop 13
- Your group has been assigned one of the datasets in the slides.
- Copy the slide matching that dataset, and add it to this slide deck [link].
- Fill it in with your group's answers about the factorial experiment.
📮 Please be sure to submit your group's response on CANVAS!
Open the full activity page →Canvas Activity: Hackathon Debrief Survey Week 9
- Hackathon participants: each team member individually completes the debrief survey (under 5 minutes).
- Your answers are entirely anonymous and cannot be connected with your name.
- Complete the form and copy the survey completion code into the Canvas text box.
📮 Submit on Canvas (1 pt) — graded on completion; your deadline is on the Canvas assignment.
Open the full activity page →Canvas Activity: Explain It (Regression) Week 10
- Find your team number (Canvas > People > Finalized Groups).
- Copy the slide matching your team's function into the shared slide deck.
- Update it with your group number and names, then fill in your answers.
- One team member screenshots the slide and submits it in the Canvas text box on behalf of the team.
📮 Submit on Canvas (1 pt) — graded on completion; your deadline is on the Canvas assignment.
Open the full activity page →Canvas Activity: Peer Review (Rough Draft) Week 10
- You have been assigned 2 group submissions from the Project Rough Draft to peer review.
- Find them in the Canvas To-Dos list or Recent Activity window.
- Give each one 1 positive comment and 1 gentle suggestion. Be nice!
- Keep a copy of your comments and paste them into the Canvas text box.
📮 Submit on Canvas (1 pt) — graded on completion; your deadline is on the Canvas assignment.
Open the full activity page →Canvas Activity: Practice Midterm Exam Week 10
- Work through the practice midterm exam, delivered through the tool linked on the Canvas assignment.
- Use it to check what you know before the real midterm exercise.
📮 Submit on Canvas (1 pt) — graded on completion; your deadline is on the Canvas assignment.
Open the full activity page →
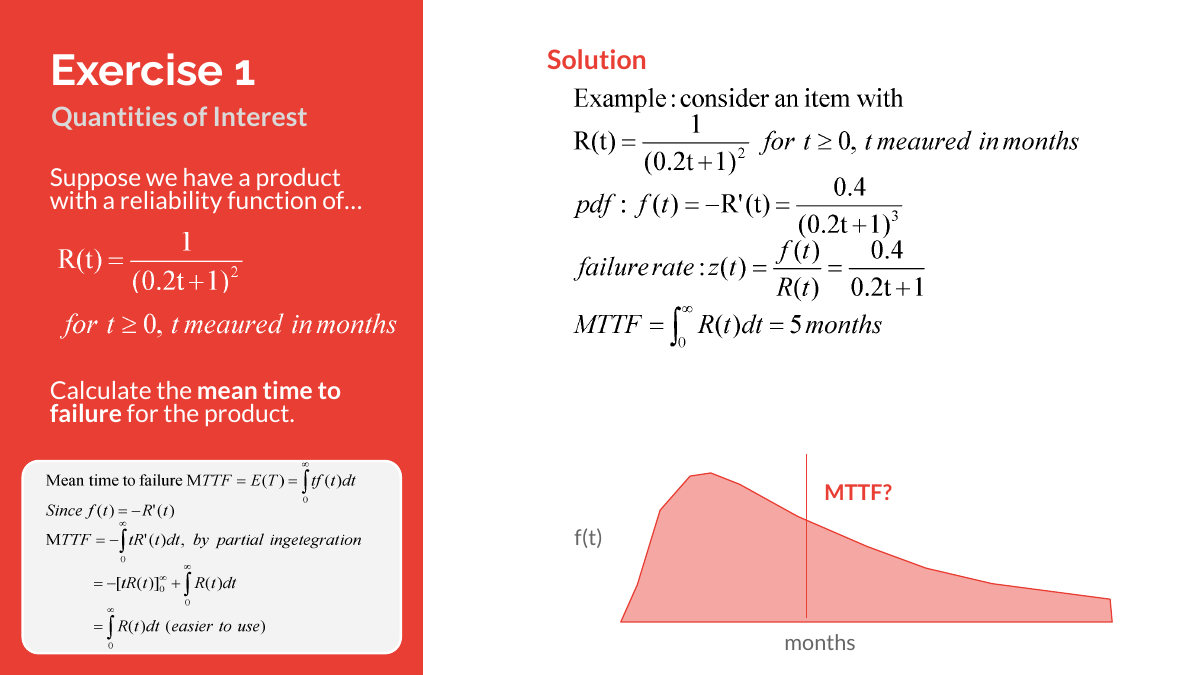 Exercises 1–3: Quantities of Interest
Lesson 7
Exercises 1–3: Quantities of Interest
Lesson 7
- Exercise 1: given a product's reliability function, calculate the mean time to failure.
- Exercise 2: given a product's failure rate function, calculate the mean residual life.
- Exercise 3: a certain type of transistor has a constant failure rate of 0.08%/K — work the probability questions that follow.
📮 Worked live; solutions follow in the deck.
Open the full activity page →
 Your turn! Calculate the rest (Chi-Squared)
Lesson 7b
Your turn! Calculate the rest (Chi-Squared)
Lesson 7b
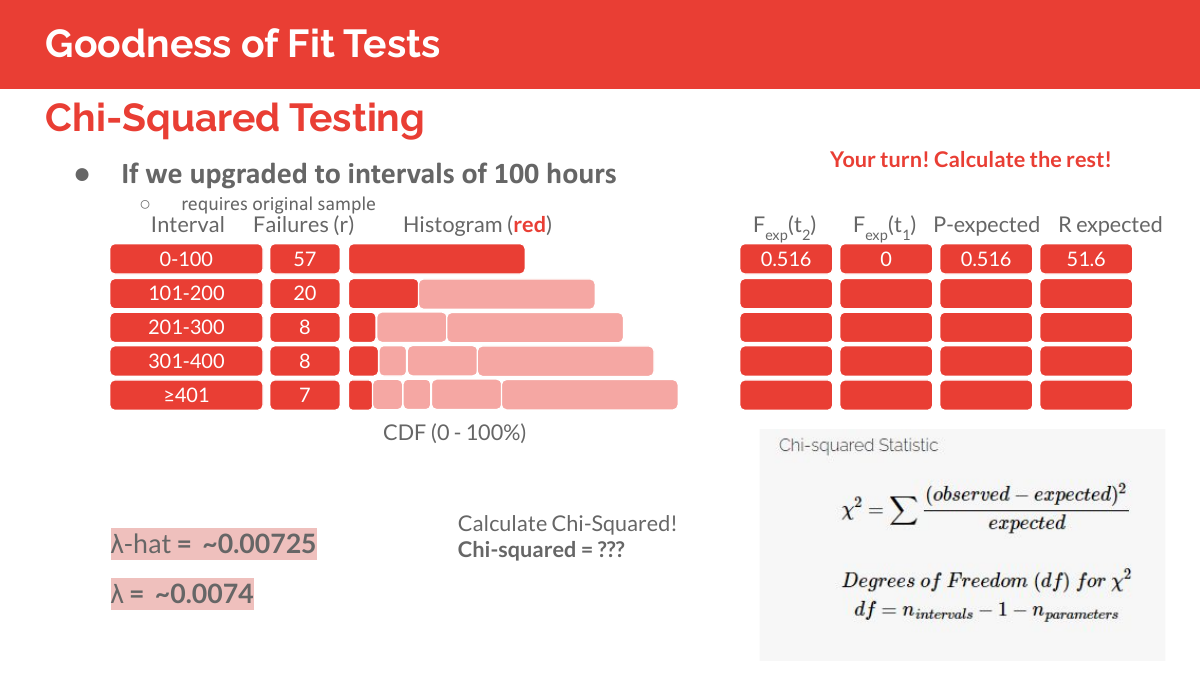
- The interval table is filled in for the first row only (0–100 hours).
- Calculate the rest: Fexp(t2), Fexp(t1), P-expected, and R-expected for each interval.
- Then calculate Chi-Squared for the goodness-of-fit test.
📮 Worked live in lesson.
Open the full activity page →Exercises 1–3: Confidence Intervals Recitation 7
- Exercise 1: Compute an 80% one-sided confidence interval — n = 200 products, failure-censored after 13 failures, lambda-hat = 0.0015 failures per hour.
- Exercise 2: Compute a 90% two-sided confidence interval — n = 300 products, time-censored at 500 hours, r = 25 failures, lambda-hat = 0.01 failures per hour.
- Exercise 3: Results analyzed under an exponential assumption give lambda-hat = 200 FITs, Type I censoring, 3 failures — compute a 95% two-sided CI for lambda. What if it was Type II censored?
📮 Worked live in recitation.
Open the full activity page →
 Example 1: Shape Parameter m (fill in the table)
Lesson 9
Example 1: Shape Parameter m (fill in the table)
Lesson 9
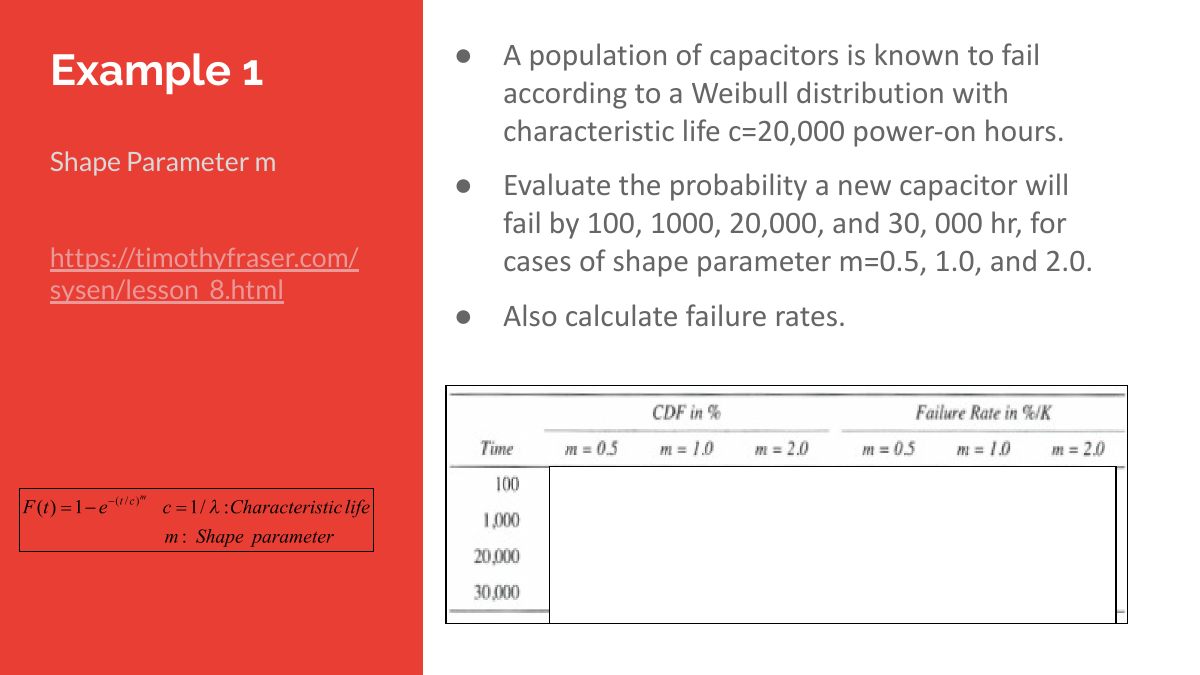
- A population of capacitors is known to fail according to a Weibull distribution with characteristic life c=20,000 power-on hours.
- Evaluate the probability a new capacitor will fail by 100, 1000, 20,000, and 30, 000 hr, for cases of shape parameter m=0.5, 1.0, and 2.0.
- Also calculate failure rates.
- Fill in the answer table in class: rows for times 100, 1,000, 20,000 and 30,000; columns for CDF in % and Failure Rate in %/K at m = 0.5, 1.0 and 2.0.
- Reminder: F(t) = 1 - e^-(t/c)^m, where c = 1/λ is the characteristic life and m is the shape parameter.
📮 Nothing to submit — filled in together in class.
Open the full activity page →
 Activity: Practice It — Likelihood
Workshop 9
Activity: Practice It — Likelihood
Workshop 9
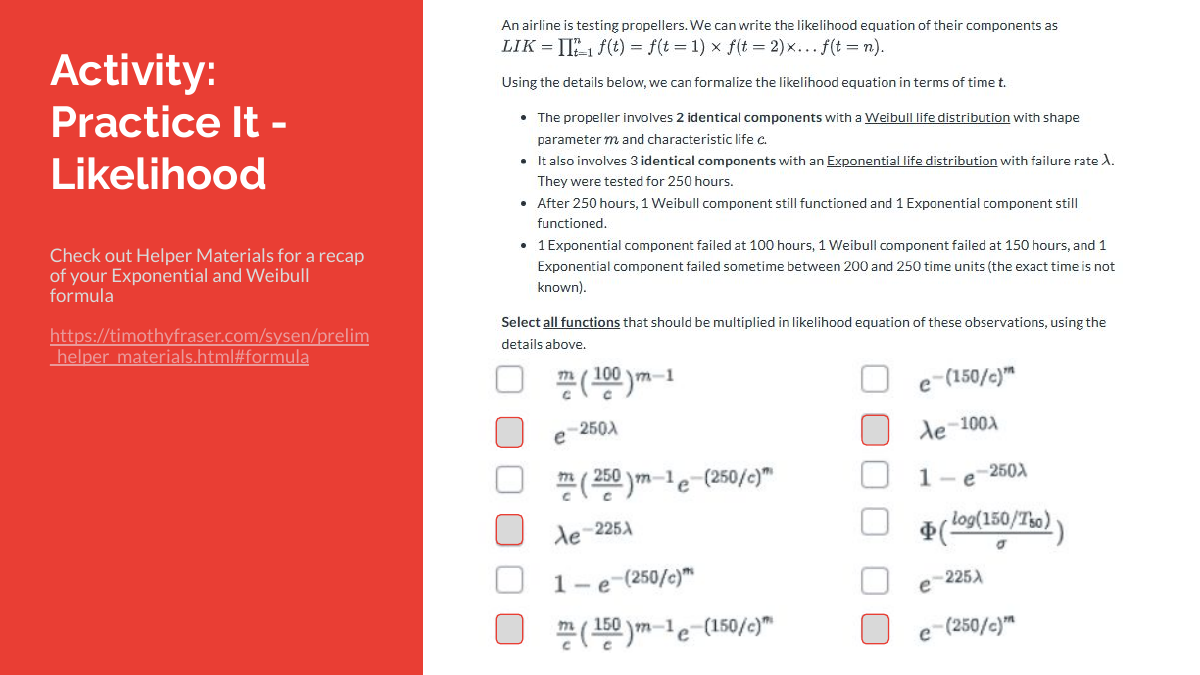
- Practice the likelihood calculations from the workshop.
- Check out the Helper Materials for a recap of your Exponential and Weibull formulas.
📮 Submit on CANVAS.
Open the full activity page →
 Exercise: Designing a Monitoring System
Workshop 8
Exercise: Designing a Monitoring System
Workshop 8
- Sketch a monitoring system from its components: sensor(s), data recording, database, data extraction, reporting.
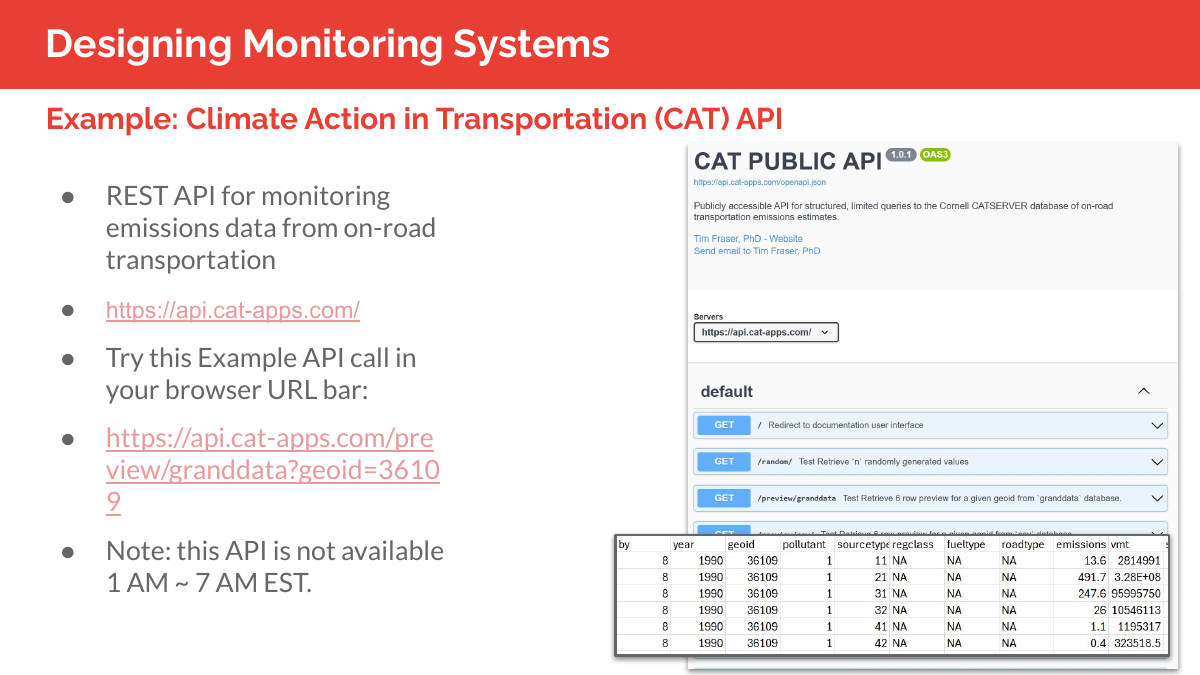
- Try the example API call in your browser URL bar: https://api.cat-apps.com/preview/granddata?geoid=36109
- Note: this API is not available 1 AM ~ 7 AM EST.
📮 Share your monitoring-system sketch in class.
Open the full activity page →Canvas Activity: Practice It — Lifespan Under Normal Use Week 13
- Work through the lifespan-under-normal-use practice set, delivered through the tool linked on the Canvas assignment.
- Practice estimating how long a component survives under normal operating conditions.
📮 Submit on Canvas (1 pt) — graded on completion; your deadline is on the Canvas assignment.
Open the full activity page →Coding Demo: Physical Acceleration Models Workshop 10
- Coding Demo — Workshop 10.
- Follow along with the workshop script: https://github.com/timothyfraser/sysen/blob/main/code/10_workshop.R
📮 Nothing to submit — coded along live in workshop.
Open the full activity page →
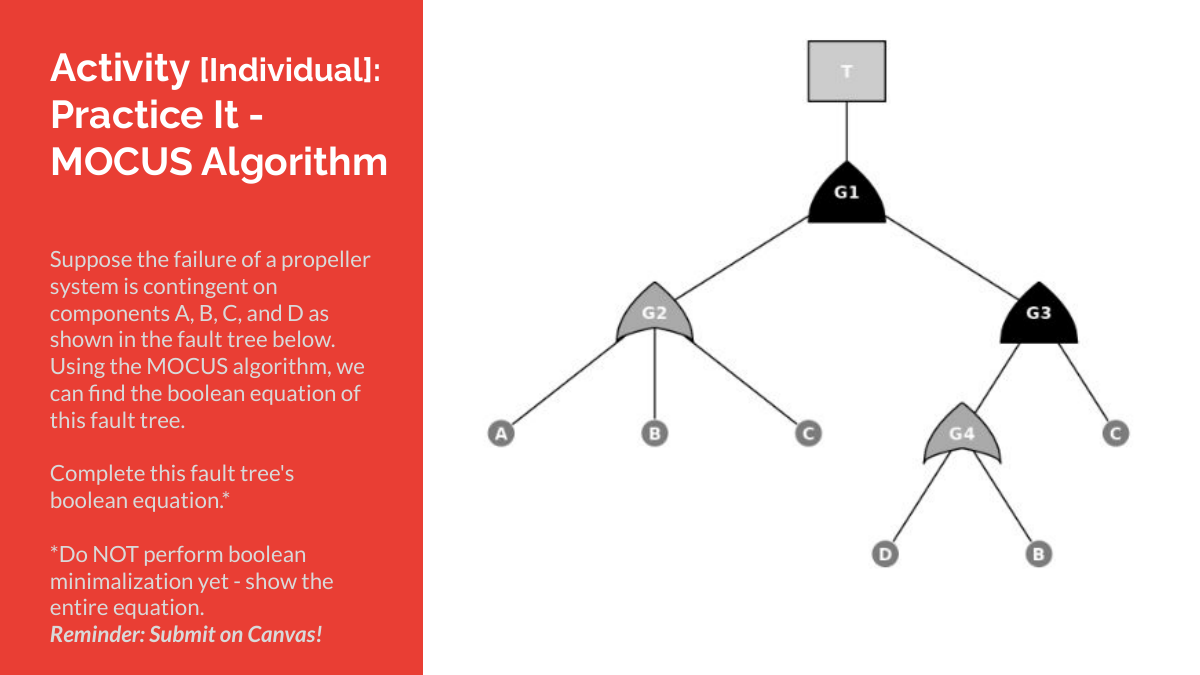 Activity [Individual]: Practice It — MOCUS Algorithm
Recitation 9
Activity [Individual]: Practice It — MOCUS Algorithm
Recitation 9
- Suppose the failure of a propeller system is contingent on components A, B, C, and D as shown in the fault tree in the deck.
- Using the MOCUS algorithm, we can find the boolean equation of this fault tree.
- Complete this fault tree's boolean equation.
- Do NOT perform boolean minimalization yet — show the entire equation.
📮 Reminder: Submit on Canvas!
Open the full activity page →
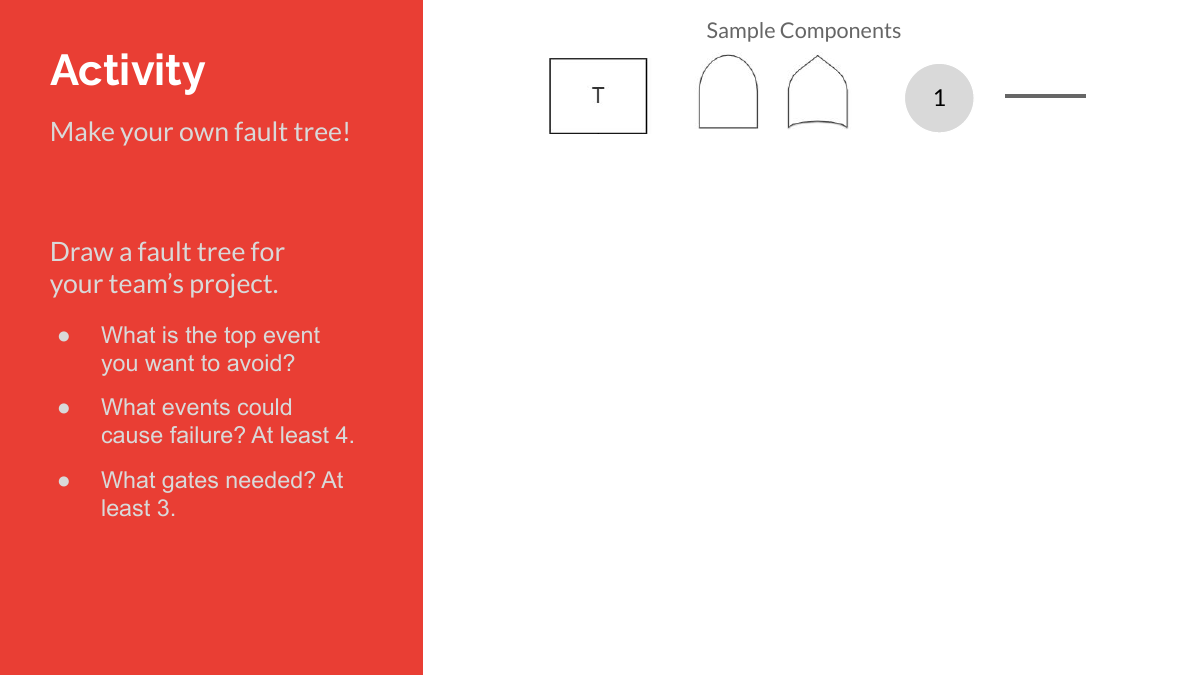 Activity: Draw It — Make your own fault tree!
Recitation 9
Activity: Draw It — Make your own fault tree!
Recitation 9
- Draw a fault tree for your team's project.
- What is the top event you want to avoid?
- What events could cause failure? At least 4.
- What gates are needed? At least 3.
- Use the sample components to draw it manually, OR draw it with Mermaid by adapting the template in the deck.
📮 Reminder: Submit on Canvas!
Open the full activity page →