← All activities
Recitation 4 · In-Class Activity
[In-Class Activity] Practice It: Block Diagrams
An in-class activity from the course slides — reproduced here so you can find it again after class.
📋 What to do
- Pick one of the four systems in the next card.
- Estimate system reliability at a specific time (e.g. t = 1000 hours), assuming an exponential lifespan distribution.
- Open the Team Boards, go to Topic Practice It Block Diagrams, and pick your system's problem. Type your team name and member names first.
- Show your reliability function and your calculation on the board.
🔧 The systems — pick one
-
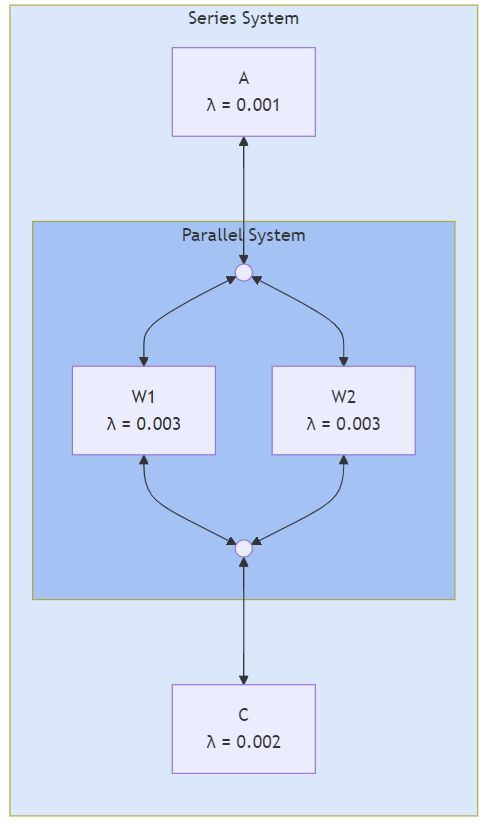
System 1 (blue). Component A in series with a parallel subsystem of W1 and W2, then component C.
Failure rates: λA = 0.001, λW1 = 0.003, λW2 = 0.003, λC = 0.002.
-
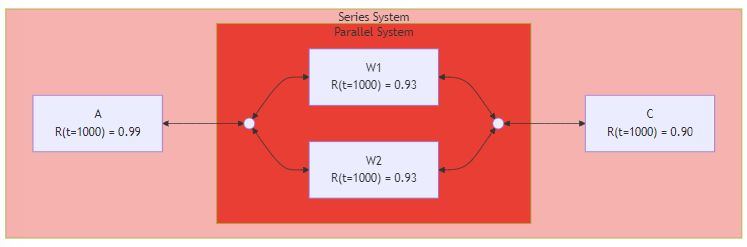
System 2 (red). Component A in series with a parallel subsystem of W1 and W2, then component C — given as reliabilities rather than rates:
RA(t = 1000) = 0.99, RW1 = RW2 = 0.93, RC = 0.90.
-
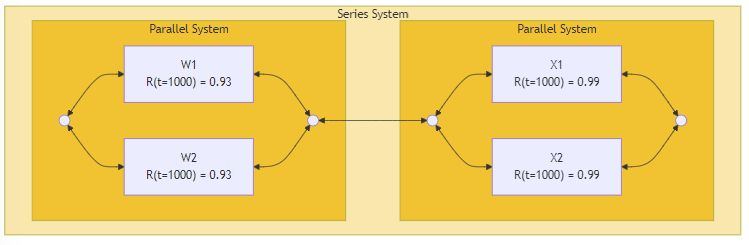
System 3 (yellow). A parallel subsystem of W1 and W2 at R(t = 1000) = 0.93 each, in series with a parallel subsystem of X1 and X2 at 0.99 each.
-
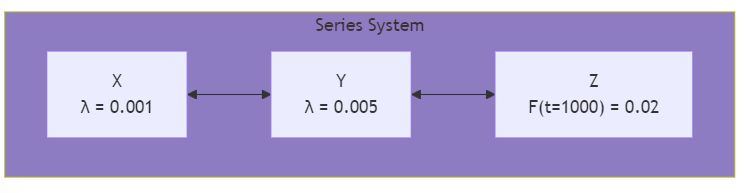
System 4 (purple). Components X, Y and Z in series, mixing rates and a failure probability:
λX = 0.001, λY = 0.005, and FZ(t = 1000) = 0.02.
📮 Submit
Submit on CANVAS (1 pt) — graded on completion.
Note: these instructions are the current version — the activity is written and kept up to date on this page, links to slide decks and helper materials included. Submit on Canvas; the due date and your grade live there.