← All activities
Recitation 2 · Practice Exercises
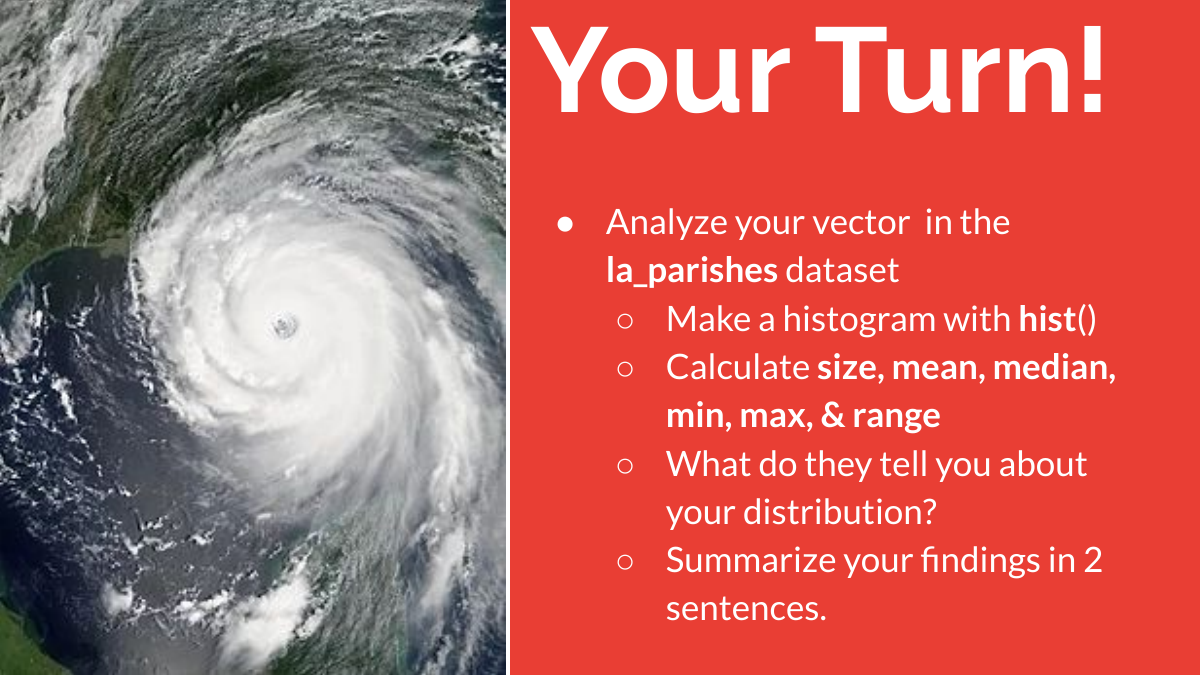
Your Turn! Analyze your vector (Louisiana Parishes)
An in-class activity from the course slides — reproduced here so you can find it again after class.
📋 What to do
- Analyze your vector in the la_parishes dataset.
- Make a histogram with hist(); calculate size, mean, median, min, max, & range. What do they tell you about your distribution? Summarize your findings in 2 sentences.
- Calculate standard deviation, variance, coefficient of variation, & standard error. Summarize your thoughts in 2 sentences.
- Calculate skewness and kurtosis. Summarize your thoughts in 1 sentence.
- Calculate parameters for each distribution (except weibull), simulate 100 observations each, visually compare your vector with the simulated data — which matches your vector best?
📮 Submit
Share your findings in recitation, then submit them on CANVAS (1 pt) — graded on completion.
Note: these instructions are the current version — the activity is written and kept up to date on this page, links to slide decks and helper materials included. Submit on Canvas; the due date and your grade live there.