

A painting of vertical bars sweeping from red through orange and yellow into teal
Week: Failure Modes & Effects Analysis

Recitation 2: Distributions & Descriptive Statistics

Practicing Descriptive Statistics
Tim Fraser
Tim Fraser, PhD
Research Associate, Systems Engineering
Cornell University
SYSEN 5300: Systems Engineering & Six Sigma
for Design and Operation of Reliable Systems
Learning Outcomes
Target with arrow in the bullseye
Risk Analysis
  • Risk assessment and risk characterization
  • Failure Modes and Effects Analysis
  • Fault trees and event trees under uncertainty
Modeling Reliability
  • Component and system reliability
  • Physical acceleration models
  • Required function, stated conditions, specified time
  • One element of the broader risk analysis
Learning Outcomes
Target with arrow in the bullseye
Quality Control
  • Six sigma and statistical process control
  • Detect when performance is deteriorating
  • Take corrective action in time
System Improvement
  • Optimize system design for reliability

  • Design of experiments
  • Response surfaces — innovation, problem solving, and discovery

Today's Class

  1. Louisiana Parishes Practice
  2. Product Comparison Practice
Painted stacked bars in cream, yellow, pink and magenta

Practice Exercises


Recitation 2
Louisiana Parishes
A corgi puppy's head peeking in from the side

Load Data

Use the readr package to load most types of data into R.

la_parishes.csv is a dataset of Louisiana Parishes (counties) describing their outcomes after the 2005 Hurricane Katrina disaster.

# Load packages
library(readr)
library(dplyr)

# Read in your dataset
la = read_csv("workshops/la_parishes.csv")

# View la parishes data
la %>% glimpse()
la %>% head()
Your Turn!
Your Turn!
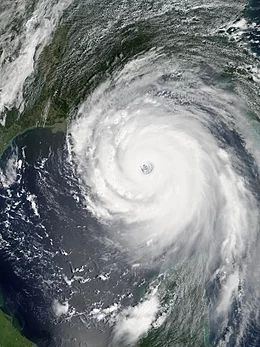
Satellite view of Hurricane Katrina over the Gulf of Mexico
  • Analyze your vector in the la_parishes dataset
    • Make a histogram with hist()
    • Calculate size, mean, median, min, max, & range
    • What do they tell you about your distribution?
    • Summarize your findings in 2 sentences.
Your Turn!
Satellite view of Hurricane Katrina over the Gulf of Mexico
  • Analyze your vector in the la_parishes dataset
    • Calculate standard deviation, variance, coefficient of variation, & standard error
    • What do they tell you about your distribution?
    • Summarize your thoughts in 2 sentences
Your Turn!
Satellite view of Hurricane Katrina over the Gulf of Mexico
  • Analyze your vector in the la_parishes dataset
    • Calculate skewness and kurtosis.
    • What do they tell you about your distribution?
    • Summarize your thoughts in 1 sentence.
Your Turn!
Satellite view of Hurricane Katrina over the Gulf of Mexico
  • Analyze your vector in the la_parishes dataset
    • Calculate parameters for each distribution (except weibull)
    • Simulate 100 observations each.
    • Visually compare your vector with the simulated data.
    • Which matches your vector best?

Practice Exercises


Recitation 2
Product Comparisons
A corgi puppy's head peeking in from the side

Product Comparisons

Cheese!

Three firms are producing cheese in Upstate New York.

Firms randomly selected units of cheese of the production line (?) and evaluated how long it took for that cheese to mold, defining that as time to failure, measured in hours.

Product Comparisons
Cheese!
a = c(50, 70, 125, 235, 230, 200, 180, 260, 300, 500, 275, 280)

b = c(300, 380, 250, 50, 55, 57, 60, 65, 100, 150, 250, 200,
      150, 175, 225, 200, 225, 250)

c= c(400, 300, 400, 300, 350, 200, 250, 300, 330, 375)
Using your powers of descriptive statistics, evaluate these distributions. Which firm would you buy your cheese from? A, B, or C?