← All activities
Recitation 1 · Visualization Practice
Visualization Practice: Make a practice visualization
An in-class activity from the course slides — reproduced here so you can find it again after class.
📋 What to do
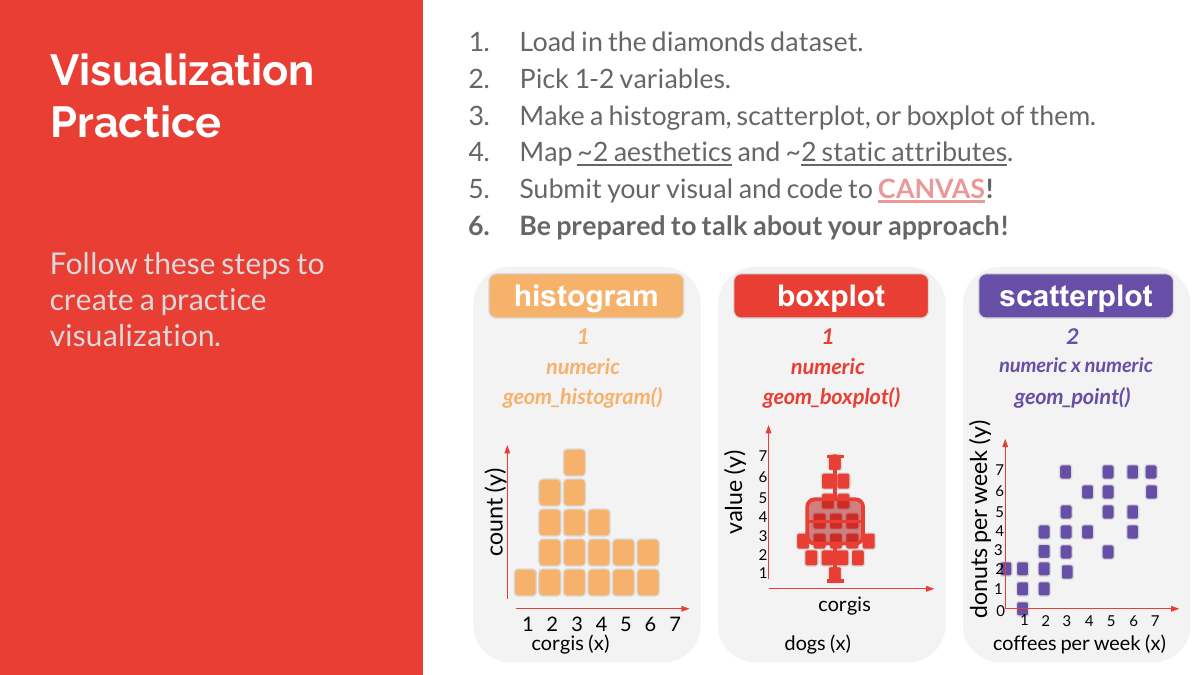
- 1. Load in the diamonds dataset. This activity uses the same one the recitation code uses — a 1,000-row sample of
ggplot2::diamonds:diamonds = ggplot2::diamonds %>% sample_n(1000)
(loadlibrary(ggplot2)andlibrary(dplyr)first). If you would rather read a file,workshops/mydiamonds.csvin the course repository is a small 3-column alternative (price,carat,cut). - 2. Pick 1-2 variables.
- 3. Make a histogram, scatterplot, or boxplot of them.
- 4. Map ~2 aesthetics and ~2 static attributes. An aesthetic is written inside the
aes(...)phrase and names a vector in the data, so it varies by row; a static attribute is written outsideaes()as a constant, so it applies uniformly to every point. - 5. Submit your visual and code to CANVAS!
- 6. Be prepared to talk about your approach!
📖 Read alongside
R track: Visualization with ggplot in R — the aesthetic-vs-static-attribute question is Learning Check 3. Python track: Visualization with plotnine in Python.
📮 Submit
Submit your visual and code to CANVAS (1 pt) — graded on completion.
Note: this page carries the live text of the activity, including the links to slides and shared materials; check back here if something looks out of date. Hand your work in on Canvas, which also carries the due date and your grade.